
Written By: Chris O’Brien, Engineering Manager |Chris Thomas, Engineering Manager| Jinyong Lee, Senior Software Engineer | Edited By: Cooper Jackson, Software Engineer

Almost two years ago, Tinder decided to move its platform to Kubernetes. Kubernetes afforded us an opportunity to drive Tinder Engineering toward containerization and low-touch operation through immutable deployment. Application build, deployment, and infrastructure would be defined as code.
We were also looking to address challenges of scale and stability. When scaling became critical, we often suffered through several minutes of waiting for new EC2 instances to come online. The idea of containers scheduling and serving traffic within seconds as opposed to minutes was appealing to us.
It wasn’t easy. During our migration in early 2019, we reached critical mass within our Kubernetes cluster and began encountering various challenges due to traffic volume, cluster size, and DNS. We solved interesting challenges to migrate 200 services and run a Kubernetes cluster at scale totaling 1,000 nodes, 15,000 pods, and 48,000 running containers.
Starting January 2018, we worked our way through various stages of the migration effort. We started by containerizing all of our services and deploying them to a series of Kubernetes hosted staging environments. Beginning October, we began methodically moving all of our legacy services to Kubernetes. By March the following year, we finalized our migration and the Tinder Platform now runs exclusively on Kubernetes.
There are more than 30 source code repositories for the microservices that are running in the Kubernetes cluster. The code in these repositories is written in different languages (e.g., Node.js, Java, Scala, Go) with multiple runtime environments for the same language.
The build system is designed to operate on a fully customizable “build context” for each microservice, which typically consists of a Dockerfile and a series of shell commands. While their contents are fully customizable, these build contexts are all written by following a standardized format. The standardization of the build contexts allows a single build system to handle all microservices.
Figure 1–1 Standardized build process through the Builder container
In order to achieve the maximum consistency between runtime environments, the same build process is being used during the development and testing phase. This imposed a unique challenge when we needed to devise a way to guarantee a consistent build environment across the platform. As a result, all build processes are executed inside a special “Builder” container.
The implementation of the Builder container required a number of advanced Docker techniques. This Builder container inherits local user ID and secrets (e.g., SSH key, AWS credentials, etc.) as required to access Tinder private repositories. It mounts local directories containing the source code to have a natural way to store build artifacts. This approach improves performance, because it eliminates copying built artifacts between the Builder container and the host machine. Stored build artifacts are reused next time without further configuration.
For certain services, we needed to create another container within the Builder to match the compile-time environment with the run-time environment (e.g., installing Node.js bcrypt library generates platform-specific binary artifacts). Compile-time requirements may differ among services and the final Dockerfile is composed on the fly.
We decided to use kube-aws for automated cluster provisioning on Amazon EC2 instances. Early on, we were running everything in one general node pool. We quickly identified the need to separate out workloads into different sizes and types of instances, to make better use of resources. The reasoning was that running fewer heavily threaded pods together yielded more predictable performance results for us than letting them coexist with a larger number of single-threaded pods.
We settled on:
One of the preparation steps for the migration from our legacy infrastructure to Kubernetes was to change existing service-to-service communication to point to new Elastic Load Balancers (ELBs) that were created in a specific Virtual Private Cloud (VPC) subnet. This subnet was peered to the Kubernetes VPC. This allowed us to granularly migrate modules with no regard to specific ordering for service dependencies.
These endpoints were created using weighted DNS record sets that had a CNAME pointing to each new ELB. To cutover, we added a new record, pointing to the new Kubernetes service ELB, with a weight of 0. We then set the Time To Live (TTL) on the record set to 0. The old and new weights were then slowly adjusted to eventually end up with 100% on the new server. After the cutover was complete, the TTL was set to something more reasonable.
Our Java modules honored low DNS TTL, but our Node applications did not. One of our engineers rewrote part of the connection pool code to wrap it in a manager that would refresh the pools every 60s. This worked very well for us with no appreciable performance hit.
In the early morning hours of January 8, 2019, Tinder’s Platform suffered a persistent outage. In response to an unrelated increase in platform latency earlier that morning, pod and node counts were scaled on the cluster. This resulted in ARP cache exhaustion on all of our nodes.
There are three Linux values relevant to the ARP cache:
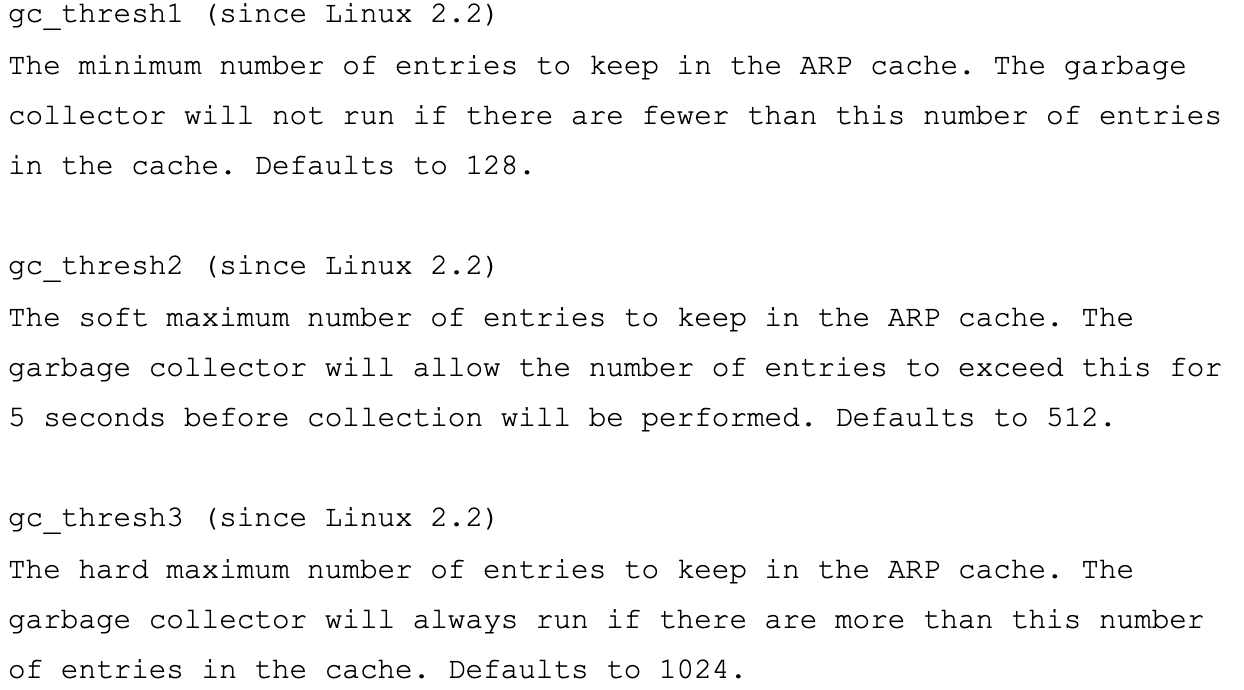
gc_thresh3 is a hard cap. If you’re getting “neighbor table overflow” log entries, this indicates that even after a synchronous garbage collection (GC) of the ARP cache, there was not enough room to store the neighbor entry. In this case, the kernel just drops the packet entirely.
We use Flannel as our network fabric in Kubernetes. Packets are forwarded via VXLAN. VXLAN is a Layer 2 overlay scheme over a Layer 3 network. It uses MAC Address-in-User Datagram Protocol (MAC-in-UDP) encapsulation to provide a means to extend Layer 2 network segments. The transport protocol over the physical data center network is IP plus UDP.
Figure 2–1 Flannel diagram (credit)
Figure 2–2 VXLAN Packet (credit)
Each Kubernetes worker node allocates its own /24 of virtual address space out of a larger /9 block. For each node, this results in 1 route table entry, 1 ARP table entry (on flannel.1 interface), and 1 forwarding database (FDB) entry. These are added when the worker node first launches or as each new node is discovered.
In addition, node-to-pod (or pod-to-pod) communication ultimately flows over the eth0 interface (depicted in the Flannel diagram above). This will result in an additional entry in the ARP table for each corresponding node source and node destination.
In our environment, this type of communication is very common. For our Kubernetes service objects, an ELB is created and Kubernetes registers every node with the ELB. The ELB is not pod aware and the node selected may not be the packet’s final destination. This is because when the node receives the packet from the ELB, it evaluates its iptables rules for the service and randomly selects a pod on another node.
At the time of the outage, there were 605 total nodes in the cluster. For the reasons outlined above, this was enough to eclipse the default gc_thresh3 value. Once this happens, not only are packets being dropped, but entire Flannel /24s of virtual address space are missing from the ARP table. Node to pod communication and DNS lookups fail. (DNS is hosted within the cluster, as will be explained in greater detail later in this article.)
To resolve, the gc_thresh1, gc_thresh2, and gc_thresh3 values are raised and Flannel must be restarted to re-register missing networks.
To accommodate our migration, we leveraged DNS heavily to facilitate traffic shaping and incremental cutover from legacy to Kubernetes for our services. We set relatively low TTL values on the associated Route53 RecordSets. When we ran our legacy infrastructure on EC2 instances, our resolver configuration pointed to Amazon’s DNS. We took this for granted and the cost of a relatively low TTL for our services and Amazon’s services (e.g. DynamoDB) went largely unnoticed.
As we onboarded more and more services to Kubernetes, we found ourselves running a DNS service that was answering 250,000 requests per second. We were encountering intermittent and impactful DNS lookup timeouts within our applications. This occurred despite an exhaustive tuning effort and a DNS provider switch to a CoreDNS deployment that at one time peaked at 1,000 pods consuming 120 cores.
While researching other possible causes and solutions, we found an article describing a race condition affecting the Linux packet filtering framework netfilter. The DNS timeouts we were seeing, along with an incrementing insert_failed counter on the Flannel interface, aligned with the article’s findings.
The issue occurs during Source and Destination Network Address Translation (SNAT and DNAT) and subsequent insertion into the conntrack table. One workaround discussed internally and proposed by the community was to move DNS onto the worker node itself. In this case:
We decided to move forward with this approach. CoreDNS was deployed as a DaemonSet in Kubernetes and we injected the node’s local DNS server into each pod’s resolv.conf by configuring the kubelet — cluster-dns command flag. The workaround was effective for DNS timeouts.
However, we still see dropped packets and the Flannel interface’s insert_failed counter increment. This will persist even after the above workaround because we only avoided SNAT and/or DNAT for DNS traffic. The race condition will still occur for other types of traffic. Luckily, most of our packets are TCP and when the condition occurs, packets will be successfully retransmitted. A long term fix for all types of traffic is something that we are still discussing.
As we migrated our backend services to Kubernetes, we began to suffer from unbalanced load across pods. We discovered that due to HTTP Keepalive, ELB connections stuck to the first ready pods of each rolling deployment, so most traffic flowed through a small percentage of the available pods. One of the first mitigations we tried was to use a 100% MaxSurge on new deployments for the worst offenders. This was marginally effective and not sustainable long term with some of the larger deployments.
Another mitigation we used was to artificially inflate resource requests on critical services so that colocated pods would have more headroom alongside other heavy pods. This was also not going to be tenable in the long run due to resource waste and our Node applications were single threaded and thus effectively capped at 1 core. The only clear solution was to utilize better load balancing.
We had internally been looking to evaluate Envoy. This afforded us a chance to deploy it in a very limited fashion and reap immediate benefits. Envoy is an open source, high-performance Layer 7 proxy designed for large service-oriented architectures. It is able to implement advanced load balancing techniques, including automatic retries, circuit breaking, and global rate limiting.
The configuration we came up with was to have an Envoy sidecar alongside each pod that had one route and cluster to hit the local container port. To minimize potential cascading and to keep a small blast radius, we utilized a fleet of front-proxy Envoy pods, one deployment in each Availability Zone (AZ) for each service. These hit a small service discovery mechanism one of our engineers put together that simply returned a list of pods in each AZ for a given service.
The service front-Envoys then utilized this service discovery mechanism with one upstream cluster and route. We configured reasonable timeouts, boosted all of the circuit breaker settings, and then put in a minimal retry configuration to help with transient failures and smooth deployments. We fronted each of these front Envoy services with a TCP ELB. Even if the keepalive from our main front proxy layer got pinned on certain Envoy pods, they were much better able to handle the load and were configured to balance via least_request to the backend.
For deployments, we utilized a preStop hook on both the application and the sidecar pod. This hook called the sidecar health check fail admin endpoint, along with a small sleep, to give some time to allow the inflight connections to complete and drain.
One reason we were able to move so quickly was due to the rich metrics we were able to easily integrate with our normal Prometheus setup. This allowed us to see exactly what was happening as we iterated on configuration settings and cut traffic over.
The results were immediate and obvious. We started with the most unbalanced services and at this point have it running in front of twelve of the most important services in our cluster. This year we plan on moving to a full-service mesh, with more advanced service discovery, circuit breaking, outlier detection, rate limiting, and tracing.
Figure 3–1 CPU convergence of one service during cutover to envoy
Through these learnings and additional research, we’ve developed a strong in-house infrastructure team with great familiarity on how to design, deploy, and operate large Kubernetes clusters. Tinder’s entire engineering organization now has knowledge and experience on how to containerize and deploy their applications on Kubernetes.
On our legacy infrastructure, when additional scale was required, we often suffered through several minutes of waiting for new EC2 instances to come online. Containers now schedule and serve traffic within seconds as opposed to minutes. Scheduling multiple containers on a single EC2 instance also provides improved horizontal density. As a result, we project substantial cost savings on EC2 in 2019 compared to the previous year.
It took nearly two years, but we finalized our migration in March 2019. The Tinder Platform runs exclusively on a Kubernetes cluster consisting of 200 services, 1,000 nodes, 15,000 pods, and 48,000 running containers. Infrastructure is no longer a task reserved for our operations teams. Instead, engineers throughout the organization share in this responsibility and have control over how their applications are built and deployed with everything as code.